
 Reserve with Google
If you are operating a website without a data reporting tool, you might as well try to sell ice to Eskimos.
Google Analytics is one of the best free web analytics tools on the market today with more than 50 million websites worldwide trusting the powerful platform. To shape your online marketing strategy, it is crucial to learn and apply practices within “Google Analytics 101 and How to Use it to Maximize Revenue”.
GA itself ties the correlation between your qualitative data and quantitative data, between your “what” and “why”. Google Analytics helps you understand basic data like the behaviour of your consumers to more comprehensive data such as Google Analytics KPI. Key performance indicators (KPI) is a quantifiable performance indicator used to monitor, analyze and optimize users practices on your website.
Not ready to face the overwhelming metrics of Google Analytics just yet? Let’s start with assimilating the preliminary metrics that help you allocate marketing budget more effectively and maximize revenue by targeting the right audience.
Google Analytics 101
Is your cost per acquisition high? Are you marketing efforts bringing in no Return on Investment (ROI)? Do you have random optimization with no end goals? With Google Analytics, you have unlimited access to a plethora of data to help you understand website traffic and optimize goals. Primary, how do you obtain and access Google Analytics? It’s free and easy! Simply follow this step by step guide on how to get started with Google Analytics.
When your business is set up on GA, you can track all website activities including traffic, landing pages, session duration, pages per session, bounce rate and more! Google Analytics is engineered for customization and allows you to create your own reports and dashboards and more.
Primary highlights of GA include:
- Custom Dashboard: When you log into your website’s profile, your dashboard is the first screen you see,- so it is vital to see the data most important to you. Google Analytics gives you the option to create somewhat custom dashboards for your analytics. Example, if website traffic and keyword referrals are most beneficial to your marketing needs, you can prioritize them on your dashboard.
- Traffic Reporting: Verifies the number of current users, new users, sessions, page views and more about your website visitors to better understand customer demand. Utilizing this data, you can track trends and even apply them to your online marketing tactics:

- Conversion Tracking: This metric tracks customer interaction with your ads — whether users purchased a service, signed up for your magazine, or downloaded your platform. Primary, you would need to establish conversion points (goals) on your website.
- Keyword Referrals: Businesses want to know how their customers find them– with the Keyword Referral feature there is no room for guessing games. You now have the power to see the keywords used by potential clients to find you, which has a potential to influence your SEO strategy. In Addition, the top metrics to pay close attention to include:
- Users
- Sessions
- Pages per session
- Devices (Mobile)
- Source/medium and channels
- Pageviews, unique pageviews
- Average time on webpage
- Landing pages
- Exit pages
- Bounce rate
We will review each essential metric in more depth.
Audience Reports
The more you know and understand about the background and needs of your audience, the better you can captivate them and maximize your revenue. Top metrics in the audience report include:
- Active Users
- Demographics (Age, Gender)
- Interests (Affinity Categories, In-Market Segments, Other Categories)
- Geo (Language, Location)
- Behavior (New vs. Returning, Frequency & Recency, Engagement)
- Mobile (Devices)
- Benchmarking
- Users Flow
User flow is the route taken by a user on a website to complete a task or action. The user flow records the users entry point through a set of steps towards a set successful outcome, such as purchasing a product or a service. It is a great metric for reducing cart abandonment rates, which we will touch on in the following sections.
Benchmarking is the process of measuring key business metrics and practices with the opportunity to compare them against competitors. This will help management improve practices, usually with the focus of increasing aspects of performance.
Behavior Metrics
To understand the behavior’s of your audience and maximize revenue, pay close attention to these metrics:
- Bounce Rates: the number people that come to your website, view one page, and leave. Tip: bounce rate is also correlates with session times.
- Exits: The number of people who exit from the site.
- Drop offs: A drop off occurs when someone exits the user flow that you are viewing. This does not necessarily mean that they are leaving the website.
A high bounce rate on content page that was engineered to intrigue your audience and continue clicking is inundating. However, assimilating bounce rates can be tricky; If a page has bounce rate of 87% but the average session time is seven minutes, it’s a safe bet that users find the page useful.
Click here for tactics to reduce bounce rate and improve engagement.
Acquisition Report
When you know the largest traffic source to your website, you gain the opportunity to operationalize marketing goals.
The Acquisition section is all about how and from which source your visitors found you. Was it through a search on Google.com, social networks, referrals or others? When you can verify the biggest online traffic source, you can invest your marketing budget more precisely and maximize revenue.
Google Analytics top channels for tracking your website traffic:
- Organic Search – Users finding you through search engines. SEO is an organic matter
- Paid Search – Users finding you through paid advertisements or ad campaigns
- Direct – Users typing your website URL into a browser or through browser bookmarks
- Referral – Users finding you from another website or 3rd party
- Social – Users finding you from social media such as Instagram, Linkden and Facebook
- Other – web traffic that is not recognized such as “email”
When you set up a goal, the Acquisition overview report will also show you how well each channel drives conversions. In the following section, we will focus on traffic and conversions.
Traffic Overview
Understanding Google Analytics 101 allows you appreciate the number of people that visit your website in a given time, fill out a section, or simply bounce. Data collection presents quantity of visitors to a webpage, where those visitors came from, how they navigated through your site, or how long they spend on each page, inter alia.
Traffic is one of the most critical data points for running a website and business. GA is engineered to segment your traffic by:
- User: Any traffic new or old
- New User: Never been on your website
- Session: The number of sessions a user encounters
Tracking sessions is a bit tricky, but think of it as sometime a user comes on the site, and then is inactive for 20 minutes, and then starts browsing again, this user will have 2 sessions, even though it will be the same user.
Data Comparison Calendar
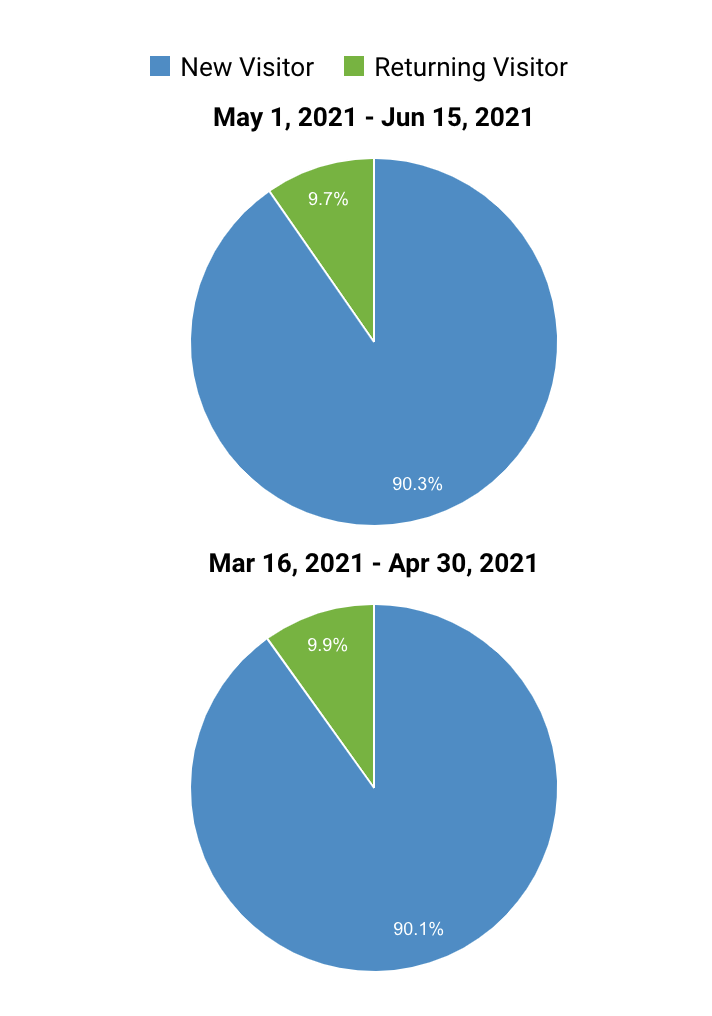
The “compare to” option is a favourite metric of mine. Google Analytics has a handy built-in feature which compares data between any time periods and it even includes charts and graphs for better illustration. This capture displays the percentage of returning users with date comparison:
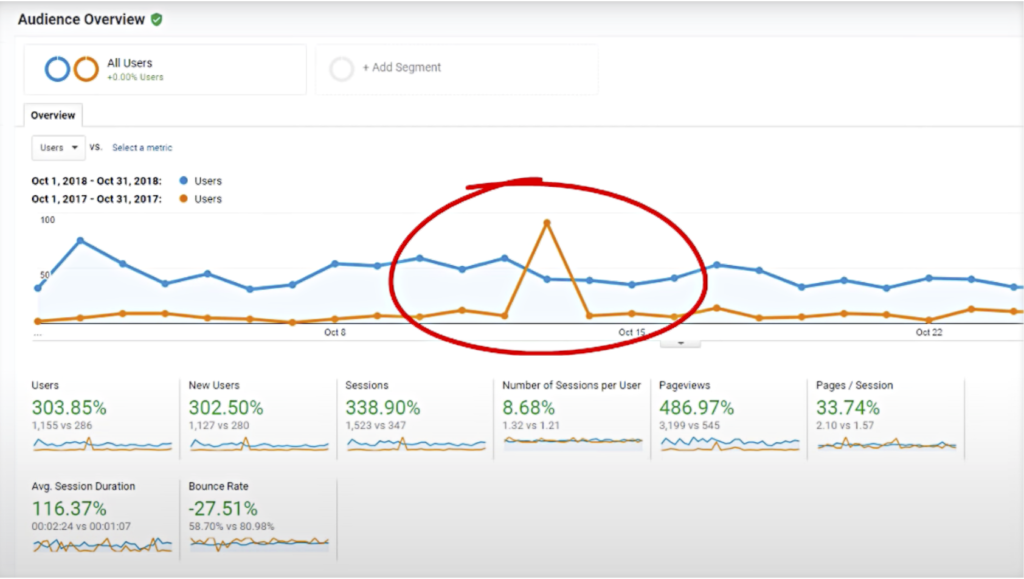
Here is another example of GA displaying data between two different ranges.Tip: Pay close attention to hips and dips in order to identify activities that could have contributed to deviation displayed in graph:
Social Overview
What gets measured gets improved. the social metric shows the impact of social media on your website. You can find the Social Overview section under Acquisition > Social.
Sometimes, we are too focused on vanity metrics that make us look presentable but lack metrics to understand our performance and shape future strategies. For instance, it is vital to understand the social measures to improve social media content. The social metrics will help you clarify things like:
- Which specific social content sent traffic to the “blog page”
- Month X had the highest traction from social media compared to Month Y. Why?
- Linkden met the conversion rate set by “Goal A”
- Facebook had the lowest bounce rate of 47%
- “Instagram stories” meet the conversion rate set by “Goal X”
As you can visualize by now, certain goals need to be created in order to track the conversion. Once you have sufficient Google Analytics 101 knowledge, you can translate where social media falls in your sales funnel. What is a Funnel in Google Analytics you ask? It is a method of understanding the steps required to reach an end result. The sales funnel presents the number of users that completed the goal you wanted complete.
Landing Pages
A powerful sector to pay particular attention to is your landing page. A landing page is a 101 metric that displays the page a user arrives at after clicking on a link that leads to your website. It can emerge from a campaign, social media channel, blog article or anywhere your website is visible. To reach your landing page, maneuver to Behaviour->Site Content-> Landing pages. This section will help you understand which of your marketing contents are captivating enough to motivate users to click on your website.
Authenticate from which source individuals are landing on which pages by clicking on the “Secondary Dimensions” tab and typing “Source” and then selecting “Source/ Medium“. This will show you the exact source that led a user to your landing page. For a comparative analysis, select and compare date ranges using the date calendar on the top right of your GA. You can as well view the data by day, week, or month but make sure you chose a date range large enough to display sufficient sample data.
Goal Conversion 101
A Goal Conversion—also shown as ‘Goal Completion’- occurs when your visitors complete a specific action set by your goal. Since the goals and conversion reporting metrics can require extensive knowledge, we will only highlight the 101 of Goals and Conversions.
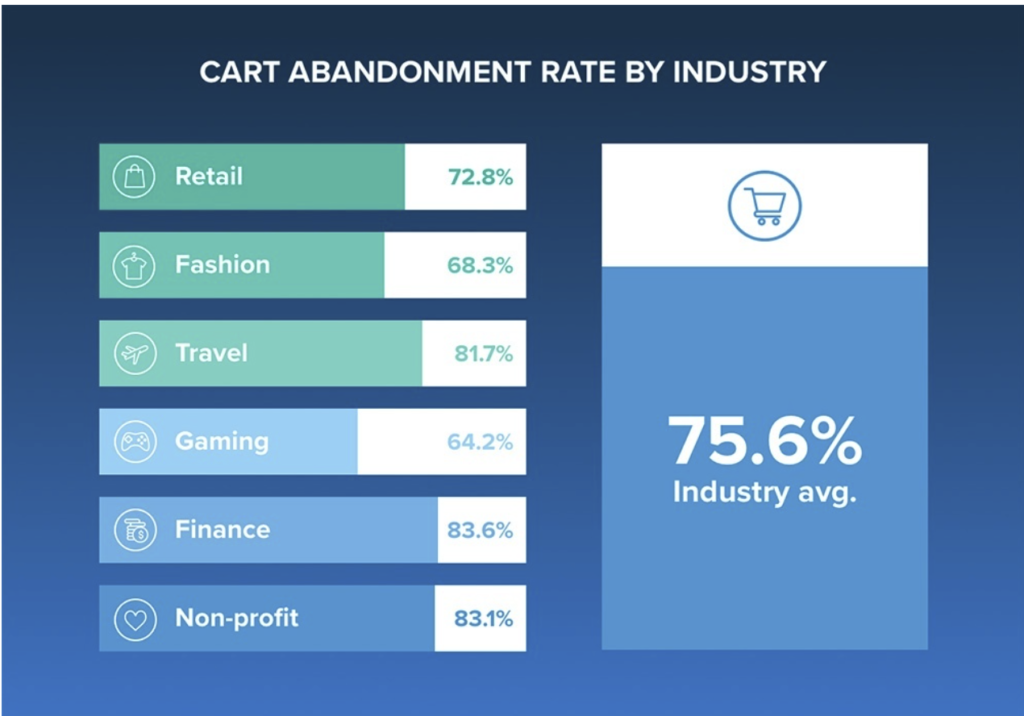
Here is a real life scenario: Users are finding you and navigating to your website, selecting the items they need but exiting with out a purchase. Ouch! You can identify the problem as cart abandonment, but you can’t figure out the issue with the checkout flow or payment system. Setting up a goal is the easiest way to better understand why users are abandoning their cart.
This problem is prevalent and it affect almost every industry. On average, over 75% of shoppers will abandon their carts and leave a site without completing a purchase:
So how does your google analytics knowledge help you maximize revenue? Understanding what’s happening behind the scenes when your shoppers make buying decisions is essential to obtain better website optimization and customer loyalty. Maybe the issue is with your homepage, the product listing page or the checkout flow. Once you identify the issue, you can then evolve with revenue based solutions.
In addition, creating goals to track conversions for campaigns (i.e Adwords) will help you analyze your Return On Ads Spent (ROAS) and maximize your revenue. First, identify the end results you want and follow these steps to set up your goal:
- Click on the “Admin” tab on the bottom left corner of your page
- Under “View” chose “Goals” option and click on the red bottom “New Goal”
- Goals are set up in three steps. You can chose the “custom” option and then name your goal
- Chose how you want your goal tracked by “Destination” “Duration” “Pages” and “Events”
- Tutorial: How to set up Google Analytics goals
For most goals, the “destination” type would be ideal in comparison to the “events” type (as events is more extensive). You may also use Google Tag Manager to set up events and goals (keep in mind you may need tech support and a developer in your reach).
Conversion Optimization 101
Why does Google Analytics not work for everyone? It is because many entrepreneurs do not understand the jargon used by the analytic software. When you understand the cause and effect relationship, you become impervious to poor decision making and inaccurate budget allocation. Instead, you can spend more money and earn more money through niche marketing and targeted ads.
Cost per click (CPC) is one of the most popular metrics of digital analytics and it is related to the cost you are paying per user to click on an ad or campaign. If you are spending $200 to reach 2000 people, naturally you will get less clicks and less clicks for more money means a more expensive cost per click. On the opposite spectrum, if you are getting lot of clicks (low CPC) but it is targeting the wrong people to your website with no action, then it doesn’t do you any good. Cost per mille (CPM) and Cost per lead (CPL) are also metrics to consider but let’s keep the learning 101 friendly!
This is why digital analytics is the core skill and Google Analytics is a tool used to implement digital analytic. Conversion Optimization is a division of DA and related to strengthening number of users who perform a desired action set by an objective. When you can identify which keywords or marketing campaign is making you the most money, you are contributing to your online business success.
“How to use Digital Analytics to generate floods of new sales and customers without spending years figuring everything out on your own?” Here is a great video explaining Digital Analytics in more depth.
Maximize Revenue
There are a plethora of data transformation tools available to optimize your traffic and maximize revenue, such as Oribi analytics. Do your own due diligence of Oribi vs Google Analytics before fully obligating, or utilize both for extraordinary results! Keep in mind Oribi is not a free platform.
A free all inclusive scheduling softwares optimized with an online booking widget which syncs to Google Analytics is an effective resource to maximize your revenue and enhance your online visibility. For instance, you are able to view and analyze your customer’s behaviour in real time and identify booking habits for better optimization.
Wrapping it Up
If you are just getting started, Google analytics can be a difficult to wrap your head around as there is a plethora of terms to understand and countless metrics to track. However, we are confidant that after reading “Google Analytics 101 and How to Use it to Maximize Revenue” will boost your Google Analytic knowledge.
How customers find you, how they navigate through your site, how long they spend on each page helps you interpret insight into areas that need improvement. Want more? Maximize your revenue with free resources that capture the behaviour of your audience in real time and offer new ways for customers to find you.
Analyzing digital data and focusing on a set of revenue based metrics, such as keyword- specified patterns to attract web traffic, will maximize your revenue.