
 Reserve with Google
What is Google Analytics?
It’s only one of the most powerful tools that a business can have in its arsenal, of course.
Google Analytics is an entirely free analytics tool designed to provide highly valuable information pertaining to your website, from the types of visitors your website receives to how they move about your website.
This data is very powerful, allowing you to target ads specifically based upon demographics or to determine how best to optimize your website for conversions and more.
If you are a beginner, this guide will show you the most important aspects of Google Analytics in order for you to maximize your business goals.
It will also show you some more advanced aspects of Google Analytics, so that you can grow with this article, offering an all-encompassing look at what you need to know in order to master Google analytics training.
When it comes to analyzing your metrics, there are a lot of options out there. Google Analytics, however, is the number one choice, allowing you to grow your business without any additional costs. Once you know the basics, it is relatively easy to navigate.
Note: You may find it helpful to scroll down to the ‘How to Install Google Analytics’ section below and setup Google Analytics first, if you haven’t already done so.
How To Use Google Analytics
When you log into Google Analytics, you will find yourself on the Home page. Here, you will see a list of all the websites you have setup (if you have more than one), as well as some basic data.
You will also see the main menu at the top with four sections: Home, Reporting, Customization and Admin – the main hub.
The most important part of Google Analytics is the ‘Reporting section,’ where you will find a list of reports that contain all of the data related to your website. If you are a beginner, you will spend most of your time in this section.
We will take you through the most important reports that all beginners should know well.
For the purposes of also offering a more advanced look at Google Analytics, we will also briefly take you through the Customization section. The Admin section, for all intents and purposes, allows you to manage all of your settings.
The Admin section also allows you to set up ‘Goals,’ which is one of the most important things you can do when it comes to making the most out of your conversion data. We will cover this after we have gone through all of the necessary reports.
The Most Important Google Analytics Reports
Indeed, Google Analytics is a data powerhouse. It is easy to become overwhelmed by the wealth of data – Google offers over 50 reports! Of course, the beginner only needs to concern him or herself with a few, which we will outline below.
To find these reports, click on the ‘Reporting’ link on the main menu. From here, you will see another list of items, including Dashboards, Shortcuts, Intelligence Events, Real-Time, Audience, Acquisition, Behaviour, and Conversions.
The latter four links – Audience, Acquisition, Behaviour and Conversions – are the main hubs for reports and there is a number of subsections within these four main categories. As mentioned, you won’t need to focus on every last report.
The first report you should familiarize yourself with, however, is the Audience report.
1) Audience Report
The Audience report provides a comprehensive look at the behaviour of your visitors. There are additional reports under the Audience section, including: Demographics, Interests, Geo, Behaviour, Technology, Mobile, Custom and User Flow.
Note: The ‘Custom’ report is for more advanced users, allowing you to define your own variables, etc. Beginners can overlook this for now.
The Audience report is important for marketing purposes and seeing which groups are most likely to convert, etc. and therefore it is beneficial for businesses to understand all aspects of the Audience report, from demographics to mobile aspects.
Here is a brief look at the data that each section offers and how businesses may find this useful.
Note: If your website is very new and you have yet to receive a lot of traffic, it is more useful for you to look at data based on a ‘Per Page’ basis. To do this, click on the ‘Reporting’ menu > Behaviour’ > ‘All Pages.’
Then, you can go ahead and view stats pertaining to the particular page that you want to see.
Here, you can learn details about the type of users visiting your website, from their location to the devices they used, and so on (all of this is self-explanatory and easy to understand as you read through your reports) – all of these metrics are important.
When you come across ‘Bounce Rate,’ this refers to the number of users that have “bounced” – that is, they encounter a page on your website but do not engage with it any further.
This metric is a good indication of how useful your content is.
The most important pages on your website should have a bounce rate of less than 50%. If your site is experiencing a high bounce rate, this is a sign that your website is not providing the type of content that visitors are seeking or, perhaps, that you have not installed the Google Analytics code properly.
Now, on to all of the subsections under the Audience report.
- Demographics – this provides data on the age and gender of your visitors. It is useful in several different ways.
For example, if you are using Google Analytics to track various ‘Goals,’ such as how well your website is generating leads i.e. how well people are signing up for your email newsletter (more on how to set up ‘Goals’ in later sections), you can look at the age and gender of the visitors who are most likely to convert.
This then allows you to target ads at these specific age groups. This is why all of the data in the various subsections of the Audience report is so valuable for businesses.
- Interests – This provides information regarding user behaviour and where they are in their purchasing funnel. Those in the Affinity category, for example, are near the beginning of their journey while those in the ‘In-Market Segment’ are ready to make purchases.
This information is not only useful in terms of targeting ads, but also in terms of content because it allows you to publish content that is of direct interest to your audience.
- Geo – Just as you would expect, this contains data on the language and location of your visitors.
The location section has a map that contains data regarding all of your visitor’s locations, which is highly useful for targeting ads, including both search and social ads. This section is also useful from a content perspective, allowing businesses to create locally-centric content.
- Behaviour – This includes additional reports and, in general, tells you about the behaviour of your visitors, by comparing things like: new and returning visitors, how often visitors return your site and how long they spend on your site or certain pages.
This is important information for a number of reasons.
For example, if you notice that people who return to your site are more likely to convert than those who are new to your site, you would want to do everything you can to get them to return, whether you try to get them to sign up for your email newsletter, etc.
Alternatively, if you notice that new visitors are more likely to convert, pop-ups would be something to look into instead.
For more information on optimizing conversions, read this supreme guide to lead generation.
At this point, you can see how useful the Audience data is regarding conversions and optimizing your website in such a way that reflects all of this conversion data. For this reason, we will move quickly through the remaining, more detailed reports under the Audience report.
- Technology – This provides data regarding the technology that your visitors use, including their browsers, operating systems and networks.
- Mobile – This tells you which devices visitors used, such as their desktops, mobiles or tablets. This data may give you the push you need in order to optimize your website for mobile users. For reference, here are all of Yocale’s mobile features.
You can find this information in the Mobile Device Info section. If you are going to create an app, for example, then you will know which device to create it on.
- Users Flow – This is an interesting report, revealing how users move through your website.
You can even look at how specific users moved through your website based on language, location, browser, etc. by simply clicking on the drop-down menu on the top-left of the page.
This is interesting because it reveals which pages of your website propel readers to continue on, and, conversely, which ones don’t.
Two additional subsections under the ‘Audience Report’ are also useful – Dashboards and Shortcuts.
Dashboards allows you to create customized reports of the data that is important to you by using widgets. These widgets prevent you from having to weed through all of your Google analytics data. Add widgets to your dashboard by clicking on the +Add Widget button.
After you have found the reports that you want to be able to have easy access to, you can use the Shortcut link to keep them easily accessible. To do this, go to the left sidebar and add them to the Shortcuts section. You can also email your reports to others.
2) Acquisitions Report
Just like the Audience report, the Acquisitions Report section offers 10 additional reports. While the majority of the Audience reports are highly useful for the average beginner, the same is not necessarily true of all of the reports that fall under Acquisitions.
In general, the Acquisitions reports tell you the source of your visitors, such as search engines, social networks or website referrals.
In general, this is valuable information because it tells you which of your marketing efforts, such as paid search via Google Adwords, are offering the biggest returns.
The beginner should focus on the following:
- All Traffic
The traffic report shows you where your visitors came from by listing the top sources of your traffic, including: organic search, paid search (AdWords), direct traffic (i.e. users typed in the URL directly or accessed it via a bookmark), referral sites, social networks and other.
- Keywords Report
This report shows you the keywords that visitors used to direct them to your website and includes both organic search and paid search.
In the past, this used to be an extremely important report, but, while it is still important, a lot of keywords are shown as “(not provided).”
However, there are several tools that can help you to figure out which keywords users are using to find your website, including Google’s Search Console (free) and Hittail (paid).
- Cost Analysis and AdWords
These sections are separate, but they are both similar.
Also, note: this is not a section that the beginner needs to concern him or herself with, but in the event that you have an AdWords account, you can connect it to your Google Analytics account in the Cost Analysis section.
This will determine your revenue while the Adwords section gives you insight into the visitors who clicked on the paid ads. Be sure to do so if you are using AdWords once you are comfortable with Google Analytics.
- Social
Under the Social report, there are a number of additional reports you can click on. Beginners, however, really only need to pay attention to two sections within the Social report: ‘Landing Pages’ and ‘Conversions.’
Landing Pages tells you which pages of your website received the most traffic from social networks.
This is another important metric because it reveals insight into what your most popular pages are, as well as popular topics – with this information, you can dial in your social media game even further.
The Conversions section tells you which social networks provide you with the most conversions.
- Search Engine Optimization
Lastly, the Search Engine Optimization report provides information relating to your website’s current state for SEO purposes. This is provided via the data from Google Webmaster Tools.
How To Navigate the Reports
When viewing a standard report, you will see a toolbar with options that are relatively self-explanatory: Customize, Email, Export, Add to Dashboard, and Shortcut.
Some of these are self-explanatory but keep in mind that if you click on the graduate hat underneath the date, it will provide you with additional information about what is contained in that particular report, so make use of that if you get confused.
Important Things To Set Up
- Goals
Now that you have familiarized yourself with all of the most necessary reports, the next most important thing you can do is to set up Goals. Under the Admin, select ‘Goals’ (this under the View section).
The Goals section collects data that is specific to a particular action on your website, such as when someone signs up for your email newsletter. This is considered a Destination goal, because it will measure when visitors reach a given destination, such as if they reach the Thank You page.
Google also allows users to track three other types of goals, including Duration goals, Event goals and Pages/Screens Per Session goals.
This KissMetrics article goes through four very important Google Analytic goals types that businesses should be tracking. Hint: It doesn’t have anything to do with tracking pageviews and visitors.
You can set up a destination goal by simply clicking on the +New Goal button.
- Site Search
Another element you will want to set up in the Admin section is ‘Site Search.’ This tells you the words that visitors entered into your search box on your website (if you have one).
To set this feature up, set up a search on your website (you will need the URL). Then, click on ‘View Settings’ under the View section. Next, scroll down the page until you see Site Search Settings and turn this setting on.
Finally, look at your URL and type in the query parameter, which is usually an s or q. Click ‘Save.’ This can be a good source of content inspiration in the future as you can create more content based on what customers who have found your site would like to read about.
How to Setup Google Analytics
Note: if you don’t already have a Google account (for example, Gmail), then you will need to sign up for that first before you can get a Google Analytics account.
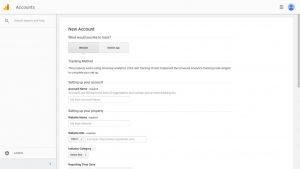
When you sign up for your Google Analytics account, you will be asked to fill out various fields, including the ‘Account Name.’ This refers to Google Analytics’ name for your website.
- Get Your Google Analytics Tracking Code
The second step is to get your tracking code, which will collect all of the data on your website. To do this, click the ‘Get Tracking ID’ button. Once you agree to the terms and conditions, you will get your Google Analytics tracking code.
- Install The Tracking Code On Your Website
The next step will address where to put the Google Analytics code. This requires you to install the tracking code on every page of your website. How you will go about this step will look different depending on the type of website you have.
When it comes to Google Analytics WordPress, you can use the MonsterInsights plugin, the most popular plugin for Google Analytics WordPress users, to install your code regardless of what theme you’re using. Note that it offers both a free and paid (Pro) version.
Once you install the plugin on WordPress, a new ‘Insights’ menu will be added to your admin menu.
From this point, you will need to go through a series of steps. Here is a great tutorial that will show you what to do, step-by-step, for installing Google Analytics on WordPress, but for the most part, this section should be relatively self-explanatory.
Here is how to install analytics tracking on other kinds of websites outside of Google Analytics WordPress.
Note: you will need to wait 24 hours before Google Analytics begins collecting any data. So be patient and you will soon have lots of information to work with!
Now that you know how to setup Google Analytics, we can move on to a few more advanced aspects of this Google Analytics tutorial.
A (More) Advanced Google Analytics Guide
We will briefly touch on a few more advanced options, when it comes to Google Analytics, for you to focus on after you’ve mastered the above sections.
- Custom Reports
At the beginning of this article, we referenced the central menu from which you will primarily navigate through Google Analytics: Home, Reporting, Customization and Admin.
We said that beginners should mainly focus on the Reporting aspect. If you feel comfortable, you can move on to Customization section and select ‘Custom Reports,’ where you can create your own reports.
Here is an in-depth guide on creating your own custom reports.
- Segments
The Segments section offers a more narrowed in look at particular aspects of your data. For example, if you are interested in looking at your data based on visitors from a specific country, this feature allows you to do that.
- Google Analytics Certification
Once you are comfortable with how to use Google Analytics, it might be time to think about Google Analytics certification wherein you take the Google Analytics IQ Exam and upon successful completion, you will receive the Google Analytics Individual Qualification (IQ).
Not only does this certification provide a structure for mastering Google Analytics training, but it also gives you access to certain perks from Google, including technical support, conferences and more.
Click here to learn how to take the exam, the resources you should study in order to prepare for the exam, and additional information you may find useful.
As you can see, Google Analytics is essential for optimizing your website and meeting your business goals.