
 Reserve with Google
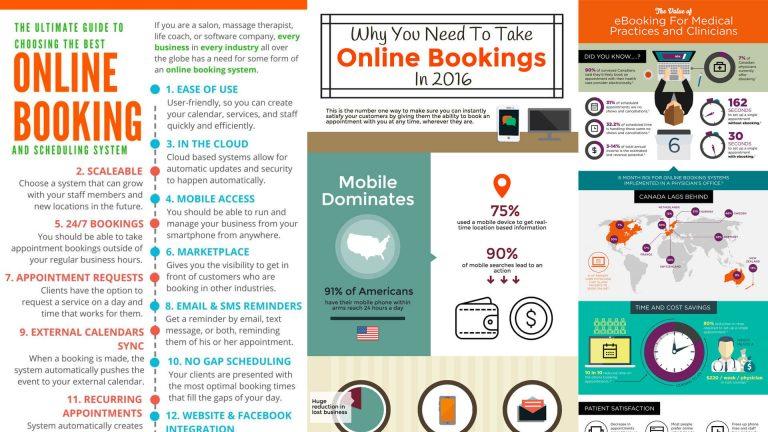
In the days of social media marketing, infographics have become the leading method of marketing and promotion by allowing businesses to show off their authority online by designing information graphics to share data with their audience.
Infographics are best served for data driven ideas and thoughts you want to get across for your business, so this is something you want to keep in mind before jumping into designing one.
And speaking of designing one, today we are going to go through how to get started, showing you ins and outs of just how easy and quick it can be to get your first infographic up and running today.
Pick A Subject You Want To Create An Infographic For
This is your most important step.
When you choose exactly what information you want to portray on your graphic, you want to ensure it is of the highest quality.
I have had the privilege of designing a half dozen infographics just for our company alone, so I can safely say that they are an effective way to get your message broadcast to your existing audience, as well as to driving brand awareness.
My company is in the business of providing online scheduling, marketing and business management for appointment based businesses. For the sample included, we tried to convey the messaging of how effective it was for wellness and medical clinics to use online booking systems within their practice.
For this we had to go out initially and find some great stats to display. We used stats that service providers can relate to and would find very interesting. We then highlighted how features and functionalities of online scheduling can help benefit them through reduced costs of admin, reducing no shows etc.
Furthermore, we peaked their interest by showing how other appointment-based businesses are taking advantage of these benefits. Lastly, what they need to know to choose the best online scheduling system for their practice. An infographics allows all of these info to be visually presented in an easy to follow and understand flow.
Not only that, it has to be incredibly shareable, as infographics are one of the easiest forms of content to share around the web. What I love about infographics is that it is easier to create engagement and engagement is what you need to make your content higher ranked.
This is due to the fact that they are very easy on the eyes in terms of having the content presented in a visually appealing way.
Do keyword research in your niche to find out what topics people are searching for, this way you know that this traffic will eventually be there to actually share your content once it’s produced.
List Out All The Data That You Want To Present
The point of an infographic, is to take raw data and present it in a way that is visually captivating to your audience in order for them to better understand the data, and allow them to easily share that infographic to their own circle.
Open up a word processing document and start creating main topic headers and sub headers of the data that will be in each of the different sections.
So for example, if you were going to talk about the best hockey sticks of 2017, then you can break them up into types of sticks, and then from you dive deeper into the different brands. You can also include data such as which professional hockey players are using those exact sticks.
If we use our medical practice example, we went out and did thorough research finding websites on Google that possibly had previous studies done. You can think about the research and data collection phase as putting all your evidence together on why your data points are valid and from where did you source your information from.
You want to make it fun and interesting. Remember the whole point of creating infographics is to get them shared amongst your audience. This is the best way to promote your knowledge through this content medium.
Start Designing Your Masterpiece
This is where the action begins and your creative juices start to flow.
Creating an infographic doesn’t have to be a difficult process, as long as you have the right tools, you can create almost anything.
A tool we use to use for creating infographics is Visme. We have found it useful for creating effective and powerful infographics.
The best part of all is that Canva is free to use to get started so there is no excuse not to set up an account.
Simply login to your account and choose the infographic type. You can then select a template from many of the options available, so pick one that you like.
Next, you can start to edit the images and the text moving things around the page. You will probably want to keep the structure fairly similar to ensure it flows as per the template.
Once you are done adding your content, images, and data, you can export it as a pdf or jpg image and then add it to your social media channels and your website.
Make sure to upload it to Pinterest as its the best place for this type of content.
When we create our infographics we always keep in the back of our mind what problem we are trying to solve for the viewer.
We also use powerful colors such as blue which is the leading color used in infographic design. From there The average infographic is around 400-500 words so if you stay within this range you are golden.
Moreover, we break up the sections into digestible portions, breaking up data you see fit in order to keep related information together.
As you can see, creating infographics is a lot easier than it looks. The only thing you have to ensure is that you plan your design out in advance as you want to make sure that you are speaking about the right topic, as well as talking about the right things with your data.